SONAR: Evaluating Voice AI Beyond English

Rashmi Nagpal, Sarick Shah, LJW, Sandeep Chinchali
May 19, 2026
1. The Demand That Outran the Infrastructure
Frontier AI labs are spending aggressively on non-English speech data. Acquisition deals for Telugu, Korean, Bengali, and Indonesian audio have grown from niche purchases to six and seven-figure contracts. An estimated three billion people speak languages that the research community classifies as "low-resource." That label is misleading. Hindi has over 500 million speakers and still qualifies. Low-resource does not mean small. It means the digital infrastructure is limited – fewer transcribed audio datasets, text corpora, benchmarks, and tools. While there are no shortage of speakers, the internet was not built for these languages, and AI training data inherits that skew. Demand indicates that the next wave of voice AI products will not be English-only, however, the infrastructure to build those products has not kept pace.
For model builders, the problem compounds. Training data is scarce, so models learn from a narrow slice of how the language is actually spoken. Evaluation data is scarcer, and evaluation tooling is nearly nonexistent, leaving teams stuck with metrics designed for English but applied to languages with entirely different properties. You cannot improve what you cannot measure.
2. The Evaluation Gap
One of the most widely used ASR benchmark in the world is LibriSpeech: 1,000 hours of English audiobook narration, with clean recordings, single speakers, and scripted text. Research has shown that accuracy can degrade by 3x to 6x when models move from benchmark conditions into real-world audio. For non-English languages, that gap is often harder to diagnose because the available benchmarks are limited. Many rely on short, scripted utterances that do not capture how these languages are spoken in real life. This creates a practical problem for teams building ASR in low-resource languages. They often have to choose a model, test it against the data available to them, report a WER number, and make deployment decisions without a clear view of where the system is truly falling short.
Three Problems Make This Particularly Challenging:
WER alone is brittle: Word Error Rate counts every difference between the model's output and the reference as an error, whether it is a hallucinated word or a perfectly valid paraphrase. For any application where meaning matters more than exact wording, WER alone can be misleading.
Averages hide demographic failures: A model can score 10% WER overall and 25% for a specific speaker group. Without the ability to slice results by demographics, these failures are invisible until they reach real users.
Evaluation never reaches diagnosis: Standard benchmarks tell you which model scored best. They do not tell you why it failed, which audio conditions are structurally hard, or what data to collect next to close the gap.
3. Introducing SONAR
We built SONAR (Semantic Output and Noise-Aware Ranking) to address these gaps. It is a recipe-driven evaluation framework for voice AI, designed for the conditions that standard benchmarks often miss: low-resource languages, real-world audio, and the diagnostic depth needed to structurally improve models, not just rank them.
SONAR is not a fixed dataset with a leaderboard. It is a configurable evaluation harness. You bring your own models (APIs or local), datasets, and definitions of what "good" means. Each evaluation run is defined by a YAML "recipe" that specifies datasets, models, normalization rules, scoring weights, and metadata slices. Adding a new language means writing a new config rather than changing the code. Existing evaluation tools tend to fall short in three ways; they reduce performance to a single metric without diagnostic context, constrain teams to fixed leaderboard datasets, or focus heavily on English-language benchmarks. This benchmark is built for the teams those tools leave behind.
SONAR measures transcription quality through three dimensions, combined into a single score, the Poseidon Score:
PSDN = 0.35 × (1 − WER) + 0.20 × (1 − CER) + 0.45 × Semantic Similarity
Word Error Rate (WER): Measures whether the model transcribed the right words. It remains the industry standard because word-level mistakes matter. If a speaker says “tank” and the model writes “bank,” WER catches that failure.
Character Error Rate (CER): Measures precision at the character level. This matters especially for languages with complex scripts, where a single character error can change the meaning of an entire word.
Semantic Similarity: Measures whether the transcript preserved the meaning of what was said, regardless of exact wording. This is the most important component, and the one that changes the picture for low-resource languages.
Semantic Similarity is of Particular Importance
Languages are not spoken the way they are written. Colloquial speech deviates from formal text. Dialects introduce alternative vocabulary. Speakers use regional expressions, contractions, and borrowed words that are perfectly understood by native listeners but diverge from any "standard" written form. In Bengali, a speaker from Kolkata and a speaker from Dhaka may express the same idea with different words, both entirely valid. In Korean, honorific levels change word forms without changing meaning. In many languages across South and Southeast Asia, code-switching between the local language and English is so common that a "correct" transcription might include words from both.
A metric that penalizes every word-level difference treats this natural variation as error. WER alone cannot tell whether a model used a valid synonym or produced the wrong meaning entirely. Semantic similarity adds that context by asking whether the transcript preserved the speaker’s intended meaning. It asks the question that actually matters for most applications: did the transcript capture what was said?
This is why semantic similarity carries the highest weight (0.45) in the PSDN formula. WER and CER remain important for catching real errors. But for languages where there is no single "correct" written form, meaning preservation is the more honest measure of quality.
On the weights, we empirically calibrated the 0.35 / 0.20 / 0.45 split during earlier internal validation. An analysis over weight combinations identified this split as the one that maximized rank correlation between the PSDN composite and human-judged transcription quality on Bengali audio (~0.92 with the chosen weights, versus ~0.75 for raw WER). The defaults travel to other languages well in our experience, but they are defaults rather than mandates. Legal transcription might increase WER and CER weights. A voice assistant might push semantic similarity even higher. SONAR is built so teams can tune those trade-offs directly, with every recipe able to override the default weights for a given run.
4. What Evaluation Reveals When You Look Closely
We validated SONAR with a deep-dive case study on Bengali (full methodology and supplementary results in the Appendix). Bengali is a useful stress test, because it concentrates several challenges that apply broadly across low-resource languages, such as multiple orthographic standards, major dialect variation, and a wide gap between formal written text and colloquial speech. We evaluated 8 Bengali-capable ASR models across 6 datasets, producing roughly 16,000 scored predictions. The findings, however, are not specific to Bengali; they are patterns that surface in any language where the evaluation infrastructure is limited.
Rankings Depend on the Data, Not Just the Model
Models that look strong on one dataset degrade on another. A model that ranks first on a public benchmark can fall to the middle of the pack on proprietary conversational audio. This is a common failure in vendor selection: teams often choose the model that wins the benchmark, rather than the model that performs best on data that matches their production use cases.
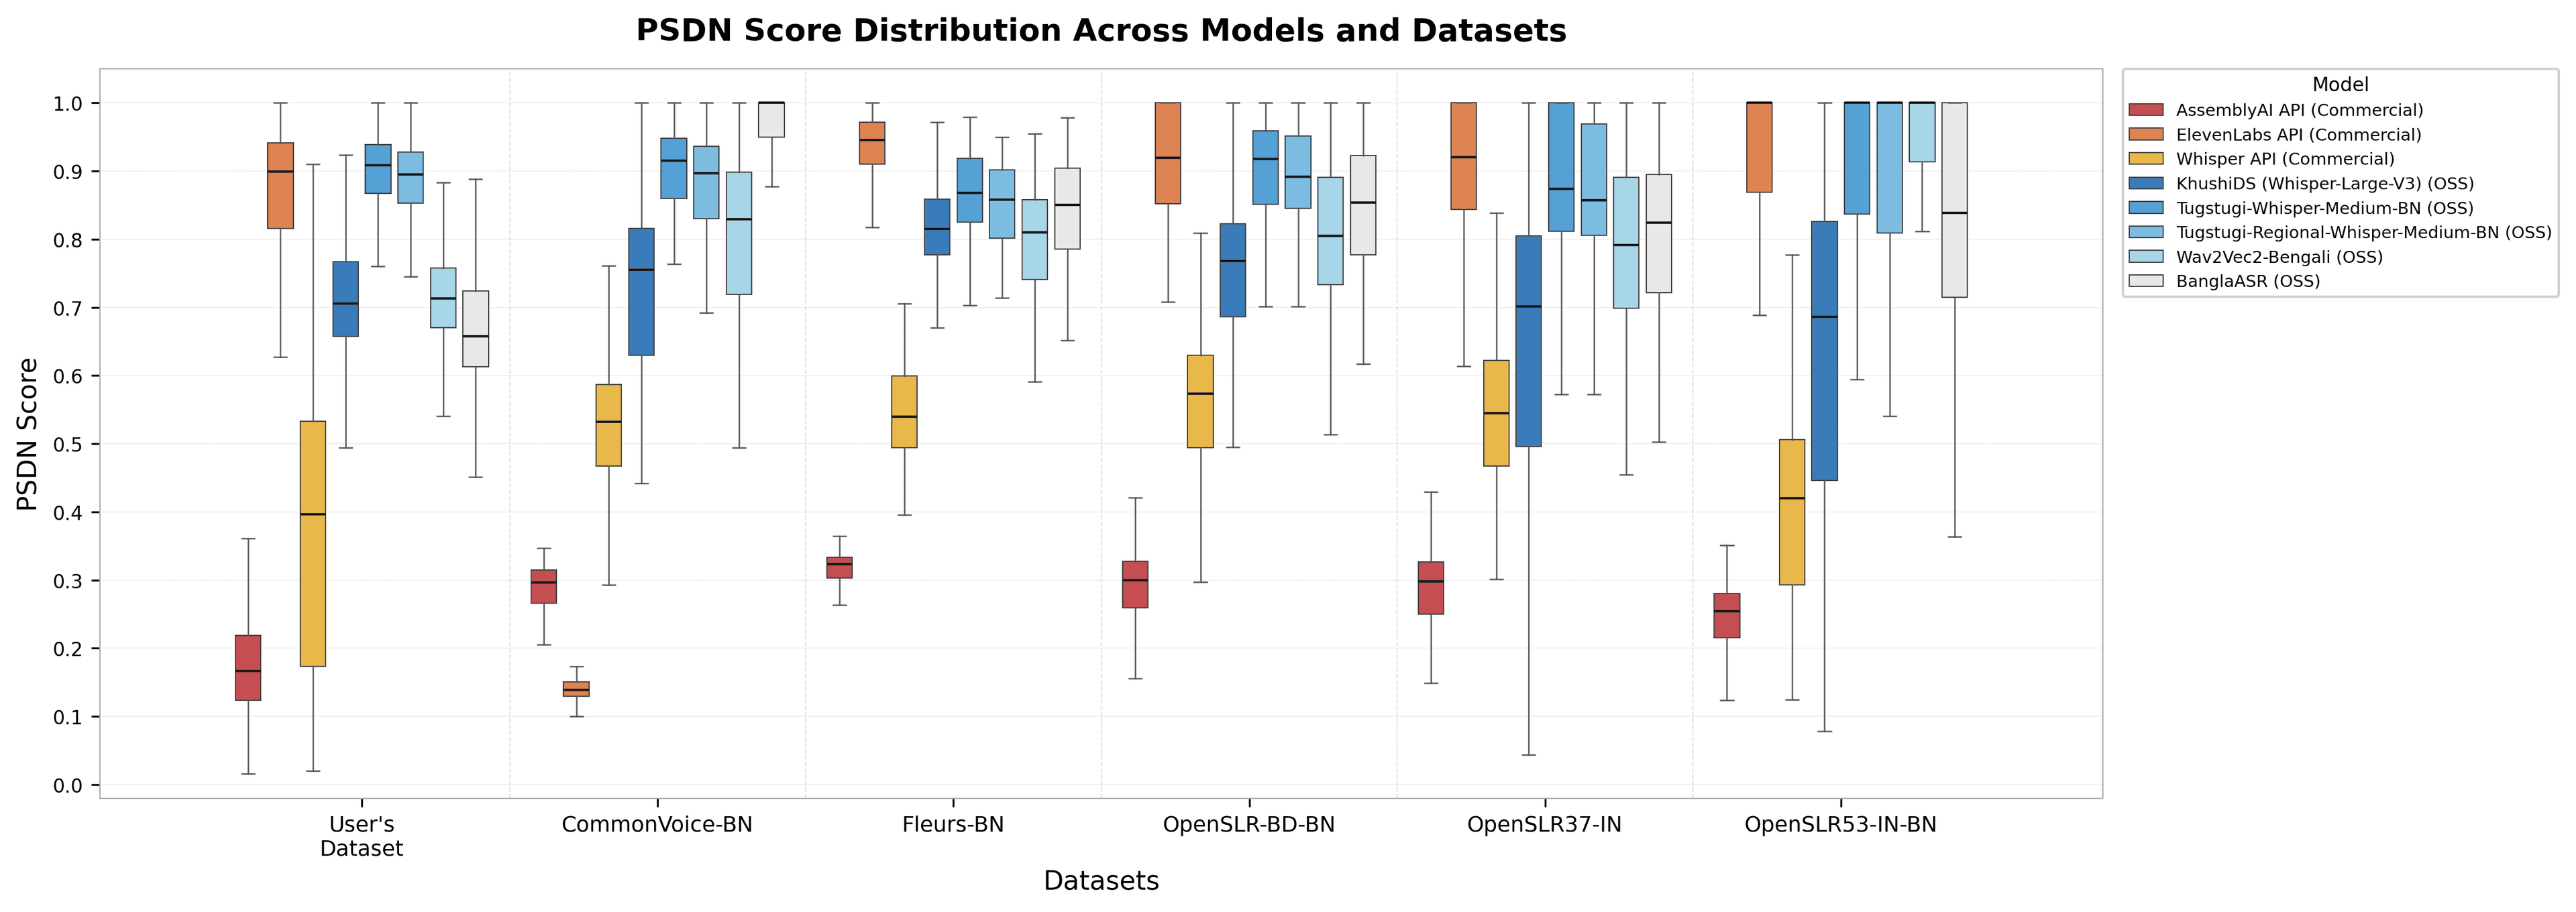
Figure 1. PSDN Score distribution across all 8 models and 6 datasets. No single model holds the top spot in every column. Rankings reshuffle as the audio conditions change.
If you are evaluating on a public benchmark and deploying on your own audio, the ranking you see may not be the ranking you get. There is also a less-obvious finding in the same figure. Several open-source Bengali fine tuned models, including the Tugstugi variants, proved to be the most dataset-stable models in the grid, tracking within a 0.10-0.15 PSDN band across most datasets. AssemblyAI and Whisper API showed more limited Bengali coverage, with AssemblyAI scoring consistently low and Whisper API exhibiting the highest variance, particularly on User's Dataset and FLEURS-BN. In this evaluation, the open-source models generalized more consistently across datasets than the commercial APIs, a finding that runs counter to common assumptions about commercial model robustness.
Averages Hide Who Gets Left Behind
To stress-test this further, we ran the same 8 Bengali-capable models against a separate proprietary multi-speaker corpus that includes roughly 8,400 gendered, region-tagged, age-tagged utterances per model. Pairwise group differences were tested with the Mann-Whitney U statistic and corrected with Bonferroni across the full per-axis grid (the more conservative of the standard multiple-comparisons options). We focus the main narrative on age, the most pervasive demographic signal we found. Both region and gender views are included as supplementary appendix figures for the reader who wants the full picture.
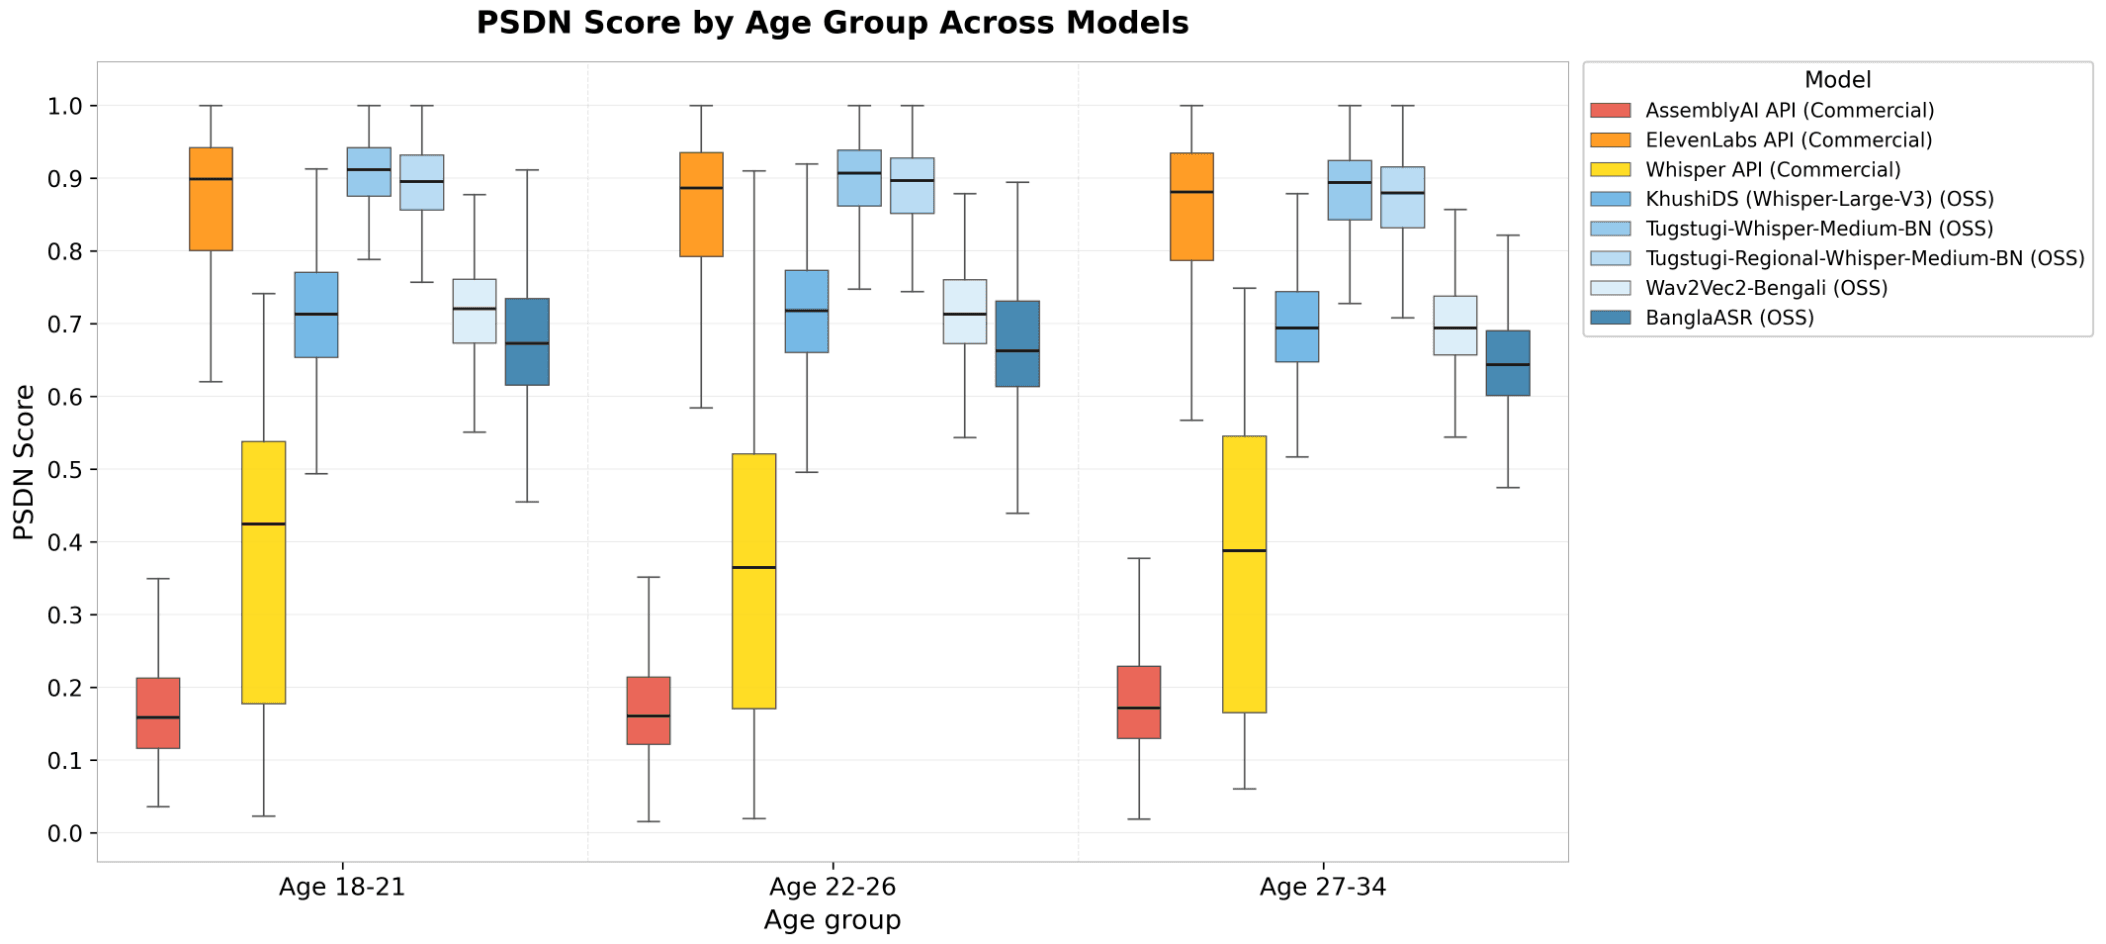
Figure 2. PSDN Score by age group (18-21, 22-26, 27-34) across all eight Bengali-capable models on the proprietary dataset. Boxes show Q1, median, Q3 and 1.5×IQR whiskers.
Three Things Stand Out in the Age View:
Open-source models surface an age effect where commercial APIs do not: All open-source models (KhushiDS (Whisper-Large-V3), Tugstugi variants, Wav2Vec2-Bengali, BanglaASR) showed at least one Bonferroni-significant age-group difference, in the same direction every time. The 27-34 bracket consistently scored lower than the 18-21 bracket, with a median drop of roughly 0.018 to 0.029 PSDN points. Five different model families, five different training regimes, all showed the same monotonic decline. This cross-model consistency suggests that the open-source Bengali training data may be skewed toward younger speakers.
The commercial-API picture needs interpreting alongside their baseline coverage: AssemblyAI's PSDN scores remained at approximately 0.16 across every age bracket, reflecting its limited Bengali coverage rather than demographic uniformity. Whisper API showed IQRs spanning 0.18 to 0.55 within a single age group, meaning real demographic differences could be statistically invisible at our sample size. This highlights an important evaluation principle that shows consistent demographic scores are meaningful only when a model has sufficient language coverage to produce differentiated results. Without that baseline, demographic consistency may reflect an absence of signal rather than an absence of bias.
ElevenLabs performed competitively across age brackets: Its medians sit between 0.88 and 0.90 across all three age groups. Bonferroni did not flag a significant age effect for ElevenLabs; non-significant results should be interpreted alongside the per-group IQR rather than treated as standalone evidence of demographic invariance.
Diagnosing Hard Negatives
We identified a set of hard negatives, audio samples where at least three of the eight models fell into their bottom-quartile (Q25 PSDN Score) of performance. Listening to a random sample confirmed a clear pattern: these clips contain heavy background noise, regional dialects, and frequent code-switching. To understand why these samples are difficult, we asked the inverse question: when a model fails, what is acoustically different about the audio?
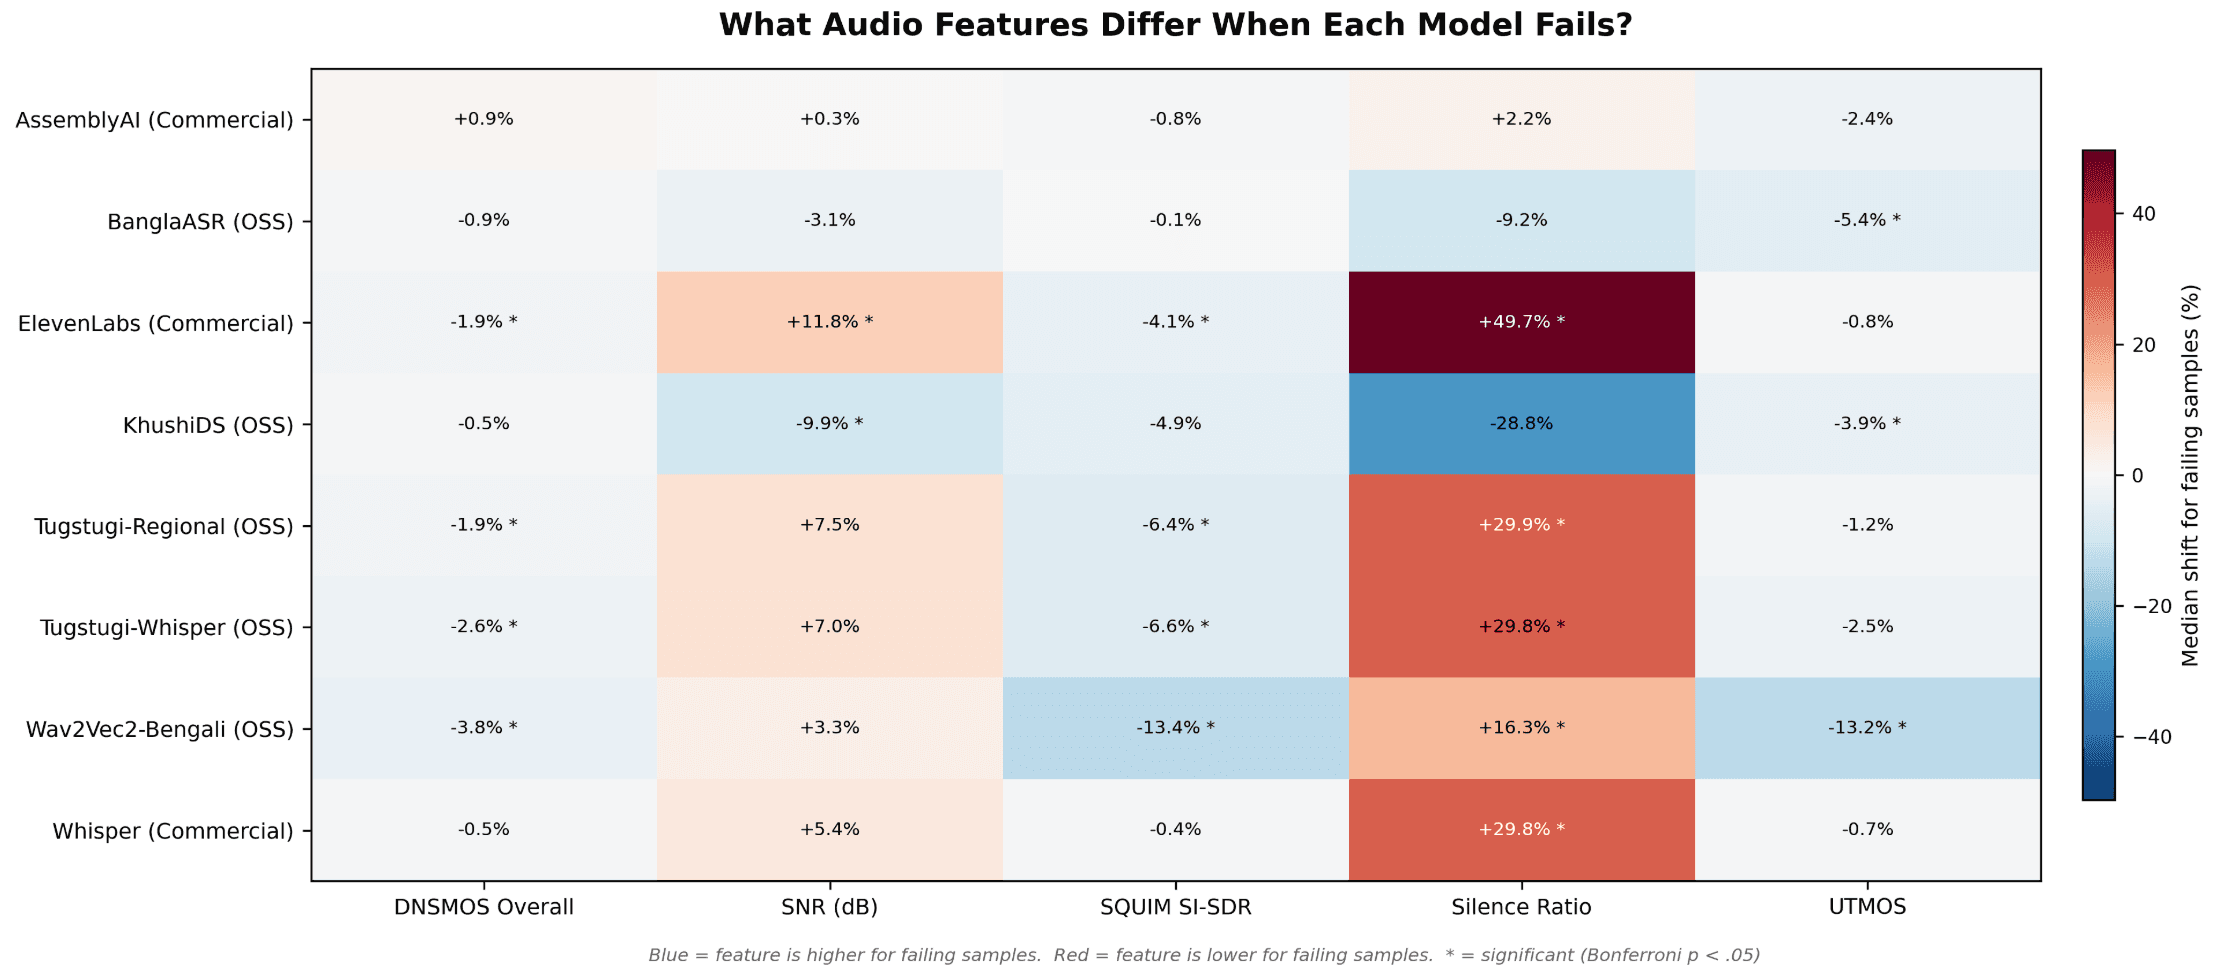
Figure 3. Per-model audio-feature shifts on bottom-Q25 PSDN Score samples versus top-Q75 samples. Cells show the median percentage shift. Blue means the feature is higher for the bottom-Q25 group; red means the feature is lower.
What Audio Features Predict Model Performance
The results show that each model has its own sensitivity profile. Different audio features predict performance drops depending on the architecture:
KhushiDS (Whisper-Large-V3): Performance dropped on noisier samples. Bottom-quartile clips showed a 10% lower signal-to-noise ratio and 29% less silence than top-quartile clips (both significant after Bonferroni correction).
Wav2Vec2-Bengali: Performance was closely tied to recording quality. Bottom-quartile clips showed a 13.4% lower SQUIM SI-SDR (a measure of signal-to-noise separation) and a 13.2% lower UTMOS (a predictor of human-rated audio quality).
This analysis turns a standard evaluation into a practical roadmap. Instead of just identifying hard samples, we know which specific audio traits challenge each model. These insights tell us exactly what to do next: which data to collect, which noise profiles to augment, and which specific cases to target during fine-tuning.
5. Why This Matters
The fragmentation in these results is what happens when models inherit the blind spots of their training data and when evaluation is not shaped like production. Improving voice AI for underrepresented languages is not a model architecture problem and not a compute problem. It is a data problem.
A model trained on unrepresentative data for a given language will produce unrepresentative results. Without rigorous evaluation infrastructure for that language, you will not know how lacking the results are until real users encounter them. There are hundreds of languages where these dynamics apply: large speaker populations, minimal web representation, no standardized evaluation tools, and growing demand for voice AI products.
We have created sonar.psdn.ai to showcase these findings across Hindi, Korean, Bengali, and English so that we can evaluate model performance across datasets and metadata slices.
Acknowledgements: The authors would like to thank Emma Joelle for her contributions to the piece.
Appendix: Bengali Case Study Methodology and Supplementary Figures
A. Methodology
Models evaluated: AssemblyAI API (Commercial), ElevenLabs API (Commercial), Whisper API (Commercial), KhushiDS (Whisper-Large-V3) (OSS), Tugstugi-Whisper-Medium-BN (OSS), Tugstugi-Regional-Whisper-Medium-BN (OSS), Wav2Vec2-Bengali (OSS), BanglaASR (OSS).
Datasets: The main 8-model × 6-dataset evaluation grid covers one proprietary single-speaker Bengali corpus (referred to as "User's Dataset" in the figures) and five public benchmarks: Common Voice, FLEURS, OpenSLR37 BD, OpenSLR37 IN, and OpenSLR53.
Metrics: Each prediction was scored on WER, CER, Semantic Similarity, and the composite PSDN Score. Results were sliced by dataset, model, and available speaker metadata (age group, region, gender).
Statistical testing: Pairwise Mann-Whitney U tests with Bonferroni correction across the full (model × pair) grid for each demographic axis.
Hard-negative identification: Samples were flagged as hard negatives when at least three of the eight Bengali-capable models scored below the bottom-Q25 PSDN threshold simultaneously, indicating structurally difficult audio rather than model-specific weaknesses.
Why Bengali: Bengali stress-tests evaluation infrastructure because of its separate orthographic standards between West Bengal and Bangladesh, multiple major dialect groups, and a wide gap between formal written text and colloquial spoken forms. Failure modes surfaced in Bengali are representative of challenges across other low-resource languages with similar properties.
B. PSDN by Region (full per-region view)
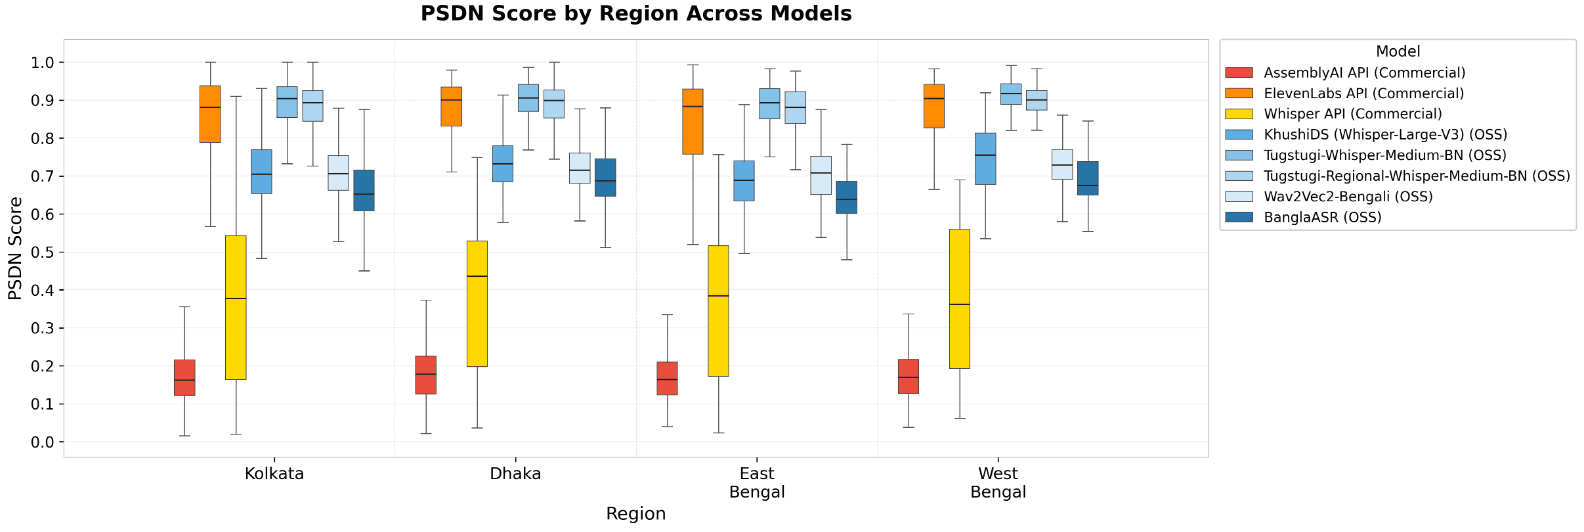
Figure A1. PSDN by Region. Data is shown for high-density regions only; low-sample areas (n < 15) were excluded to maintain statistical power. Four models, including one commercial API (ElevenLabs), showed a significant performance gap favoring Dhaka over East Bengal (max Δ ≈ 0.048 PSDN, p < .001 for BanglaASR), while others remained region-invariant. This suggests that regional performance variation is driven by training data composition rather than architectural constraints.
C. PSDN by Gender
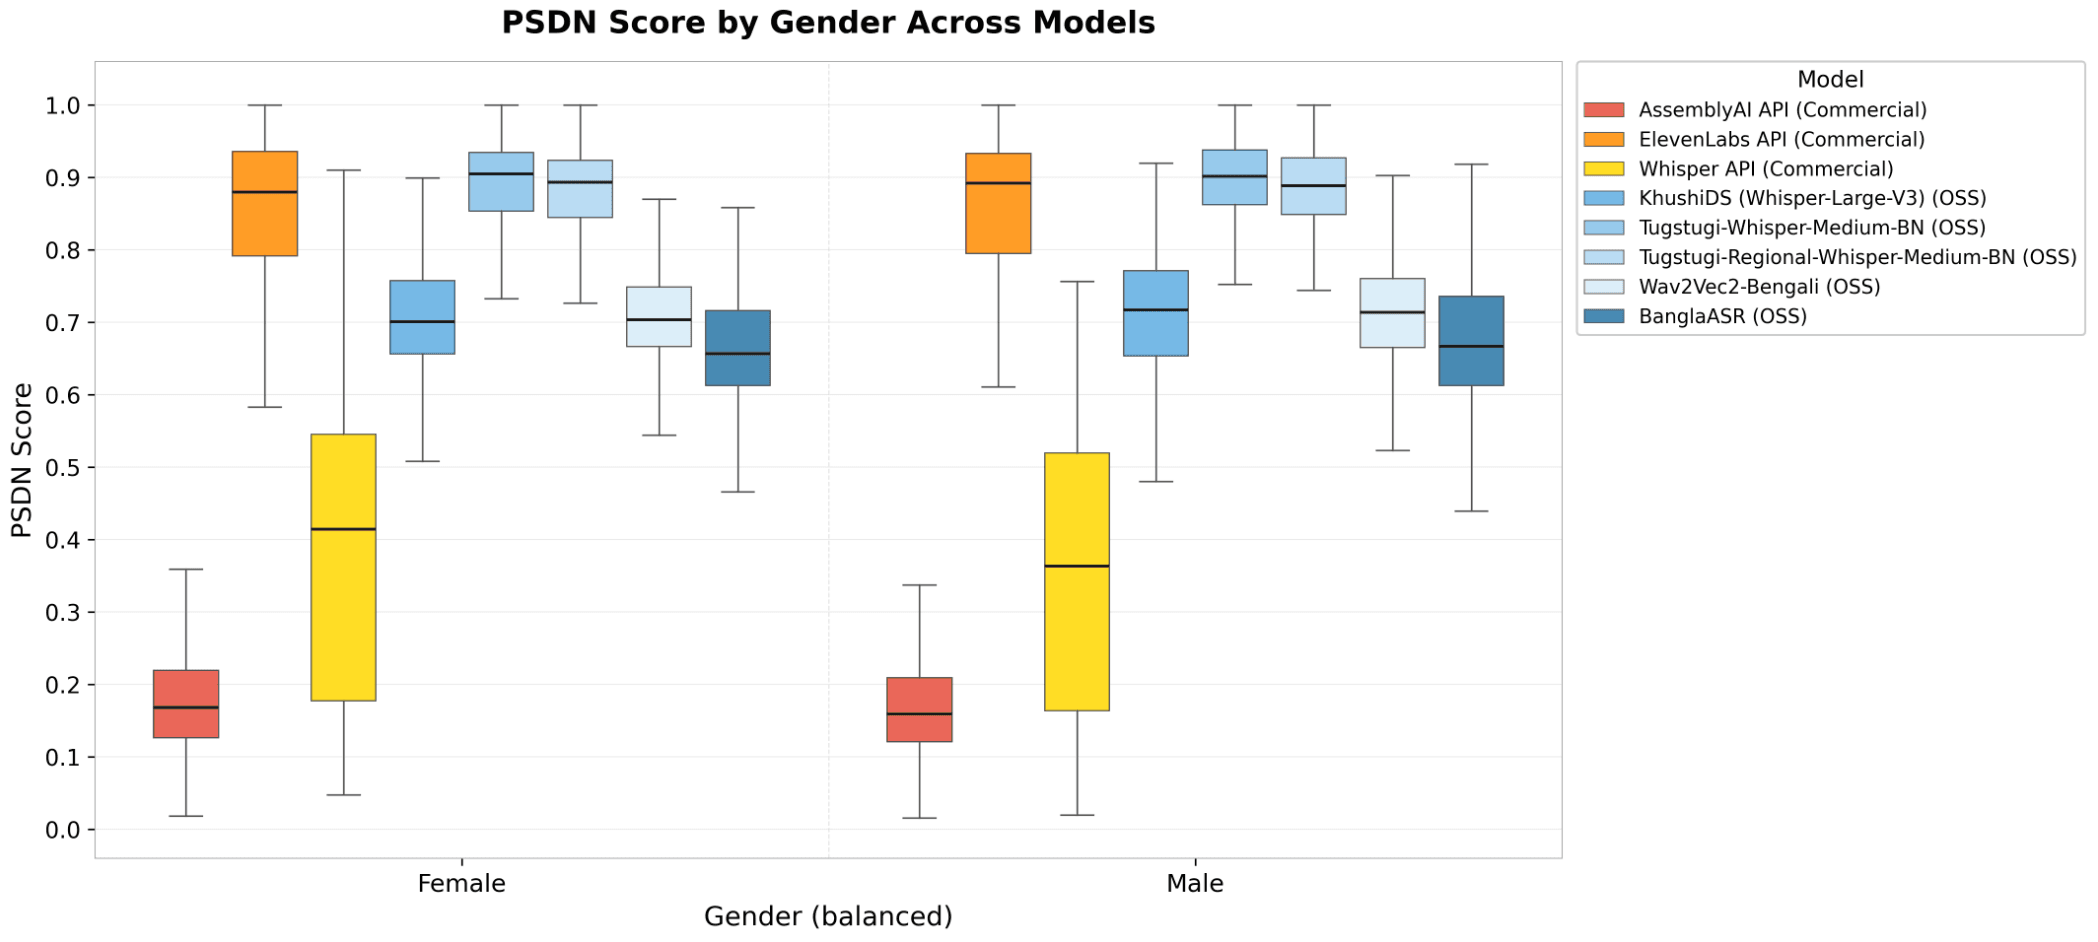
Figure A2. PSDN distribution per (model, gender) on a balanced sample (subsampled to min(n_F, n_M) per model with seed 42). Pairwise Mann-Whitney U: 0 / 8 model comparisons reach Bonferroni significance at alpha = 0.05. Whisper API showed the largest visible gap (5.1 PSDN points, female-favoring), though the difference did not reach significance after Bonferroni correction due to high within-group variance. Every other model lands within 1.7 PSDN points of its F vs M counterpart.
D. WER by Region (single-metric view)
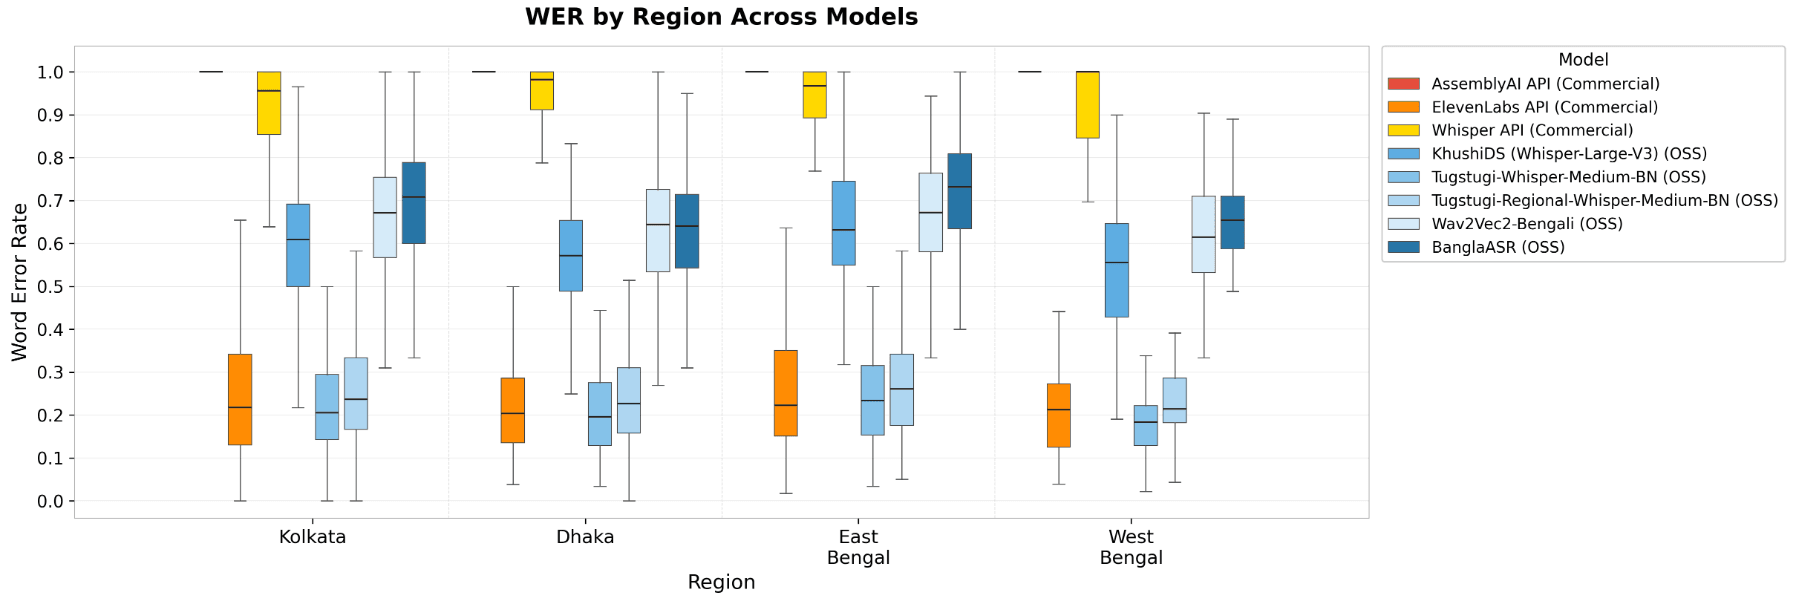
Figure A3. WER (rather than PSDN) by region across models, single-metric view. The 3x regional WER swing was most pronounced for AssemblyAI (WER near 1.0 across all regions) and Whisper API (WER ranges from ~0.4 to >0.95 across regions), both of which had limited baseline Bengali performance. ElevenLabs and the Tugstugi variants are roughly region-stable, with WER staying within a 0.15-0.35 band across the dense regions. The useful signal is cross-metric agreement with Figure A1: every Bengali-capable model has higher median WER in East Bengal than Dhaka, with the largest bumps for the same two pure Bengali fine-tunes (BanglaASR +0.09 WER, KhushiDS +0.06).
E. LLM-Judged Metrics on Hard Negatives
Aggregate scores hide what kind of usable information is lost when a model fails on a hard sample. To put numbers on this, we ran Gemini-3.1 Pro (temperature = 0) as a judge on a stratified sample of 150 audio clips (75 hard negatives, 75 non-hard negatives) across five models (AssemblyAI, ElevenLabs, Whisper, Tugstugi-Whisper, Wav2Vec2-Bengali), 749 evaluations in total. The numbers in this appendix are directional rather than conclusive – five models, 150 clips, single judge. We treat them as a sanity check on what the PSDN signal is missing, not as headline metrics. Two judge metrics:
Entity Preservation Score (0 to 1): Are named entities (names, numbers, companies, places) correctly transcribed?
Intent Pass Rate (0 or 1): Does the transcription preserve the core meaning of the utterance?
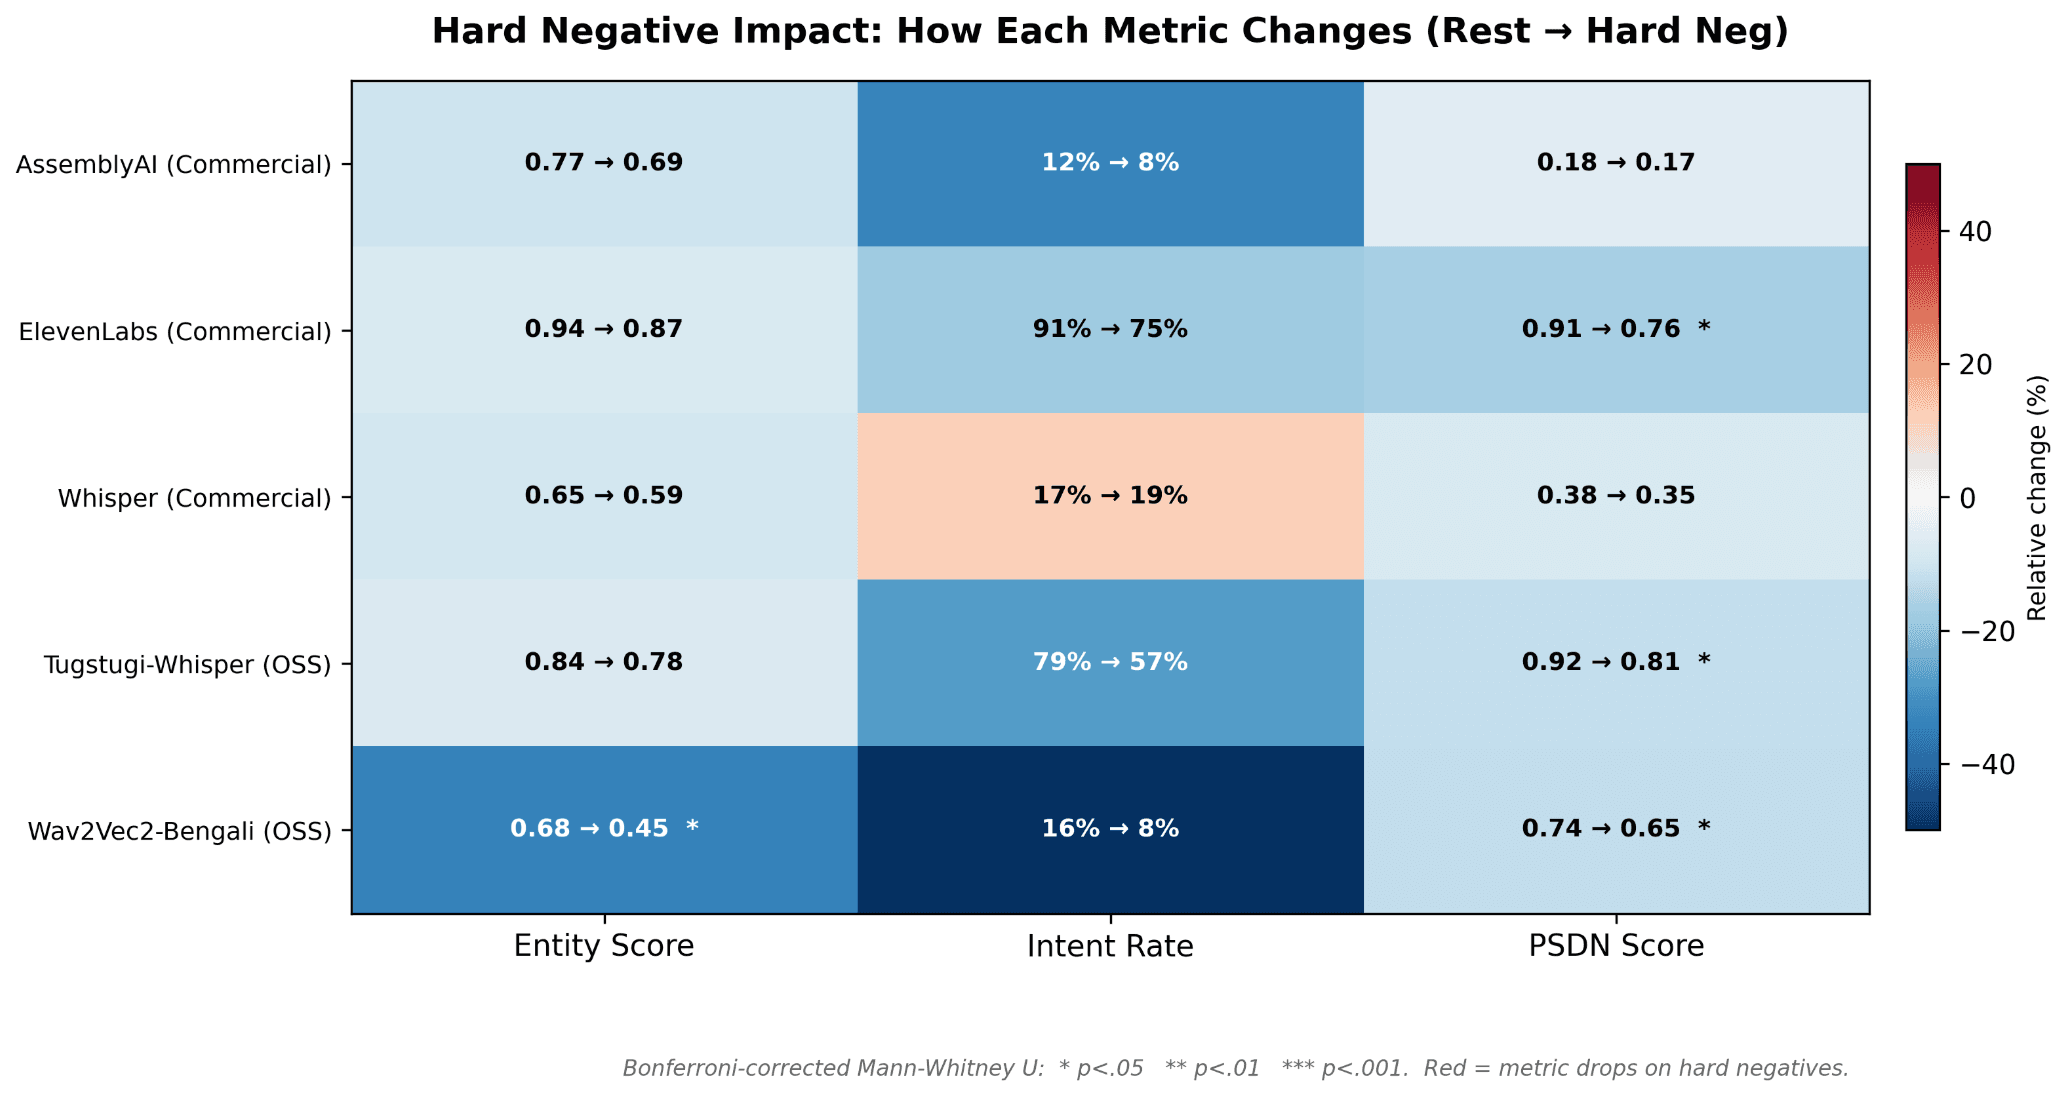
Figure A4. Per-model change from the "Rest" sample (a size-matched random sample of utterances NOT classified as hard negatives) to the "Hard Negative" subset on three metrics: Entity Score, Intent Rate, and PSDN Score. Cell values show the rest-sample median followed by the hard-negative median.
The Key Takeaways From the LLM-Judged View:
Hard-negatives impact competitive models: Wav2Vec2-Bengali model’s Intent Rate fell from 16% to 8%. This shows that hard negatives represent edge cases that all model builders need to account for as these edge cases may show up in real world speech cases.
Wav2Vec2-Bengali showed the sharpest disagreement between PSDN and the LLM-judged metrics: Its PSDN dropped from 0.74 to 0.65 (a 12% relative drop), while its Entity Score fell from 0.68 to 0.45 (-34%) and its Intent Rate declined from 16% to 8%. This divergence indicates that PSDN alone may understate the practical impact of hard negatives for some architectures. This is exactly the gap the SONAR loop is designed to surface.